In the October issue of The Granby Drummer, Michael Guarco wrote with lucidity about the mill rates in Granby and the factors that influence them. One of the points made in this article was with regard to school expenditures. Specifically, it was stated that, despite spending considerably less than the state average per pupil, testing results placed Granby students relatively high. Echoing this sentiment, Melissa Migliaccio writes in her endorsement of Lynn Guelzow in the same issue of the Drummer that “Granby’s cost per pupil is in the lowest quartile in the state, yet student achievements consistently place Granby Memorial High School in the top of ranking,” as demonstrated by it being placed at #21 in the state. Sentiments of this kind have been expressed many times in the recent past and these accomplishments of our students, while noteworthy, bear closer investigation. In particular, it will be shown in what follows that the picture is not nearly as rosy as has been portrayed, when considered from a different perspective.
First, let us examine Granby’s school performance relative to peer towns rather than the state as a whole. Specifically, it would be more fair to compare how we stack up against towns with similar demographics, income levels and mill rates rather than, say, a more urban environment. To this end, the results of the annual Smarter Balanced Assessment Consortium (SBAC) testing in Mathematics and English Language Arts (ELA) over the past four years for the major towns in the Farmington Valley are shown in Table 1. The same data are depicted more visually in Figure 1.

It is immediately apparent from the above data that Granby does not fare particularly well in comparison with our Farmington Valley neighbors. Specifically, Granby is in fifth place in Mathematics and fourth place in ELA. Noting that the gap between the top and bottom performers is about 10 points for ELA, the fourth place in this area is somewhat less significant, although the discrepancy cannot be ignored. On the other hand, the gap between the top and bottom performers in Mathematics is greater than 20 points so that Granby’s last place should be a matter of concern. Moreover, it is clear that while Simsbury, Farmington and particularly, Canton have demonstrated progress, Granby has not, apart from a small increase in the last year.
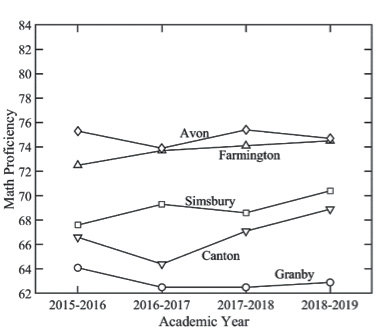
Figure 1a. SBAC proficiency percentages for Math for Farmington Valley towns over the last four academic years. 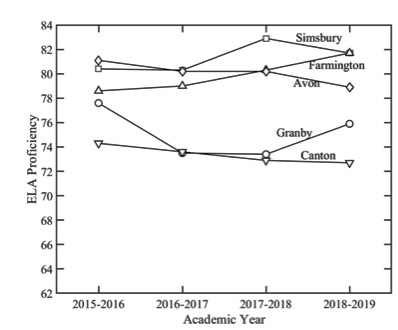
Figure 1b. SBAC proficiency percentages for ELA for Farmington Valley towns over the last four academic years.
The natural question arises as to why Granby’s performance is significantly lower than the rest of the Farmington Valley. There are no obvious differences in demographics or socio-economic levels that would lead to this discrepancy, so it would seem that the performance differential is a consequence of community investment in the students. This hypothesis is explored in Table 2, which shows the Net Current Expenditure per Pupil (NCEP) for the 2017-2018 academic year. Indeed, the spending per pupil in Granby is the lowest in the Farmington Valley. As observed earlier, this appears to be a point of pride for some commentators since Granby places fairly high in overall state rankings. However, the consequence of the lower spending is that we perform lower than our neighbors. Also shown in Table 2 is the mill rate for each of the towns. In this regard, Granby is seen to have the highest mill rate. This leads to the inescapable conclusion that the return on investment of homeowners (as measured by school performance) is poor and that families seeking to move to the Farmington Valley would be better off in any of the other towns. I believe this will have a deleterious effect on Granby’s population in the future, undoing all of the efforts put into raising the profile of Granby schools in recent years.

What, if anything, can be done about the current state of affairs? One straightforward answer, based on the apparent correlation between school performance and student spending in Table 2, would be to increase the latter. This would immediately imply higher taxes for homeowners since commercial taxes in Granby account for only 8 percent of the base, as was pointed out in the article by Michael Guarco. However, Mr. Guarco also points out that Granby has the lowest proportion of commercial real estate taxes in the Farmington Valley, by nearly 10 percentage points. Clearly then, a path toward increasing school spending without placing undue burden on homeowners, would be to grow the commercial tax base. There will be the inevitable concern that doing so would lead to a loss of the rural character of the town, but this does not have to be the case. A drive through Simsbury provides sufficient evidence that it is possible to retain the rural character of a town while simultaneously increasing the commercial real estate footprint. Apart from increasing the tax base, having more businesses in town would also greatly increase convenience for residents who have to drive long distances for many things. The other point to note is that times change and we need to evolve as well. Well into the second decade of the twenty first century, we cannot expect that the makeup of Granby should remain the same as it was 50 years ago. Attempting to do so will lead to declining fortunes and fewer opportunities for our children.
Finally, I would like to return to issue of the relatively poor Mathematics performance of the Granby schools. Given these large differences, it would be worthwhile for the Board of Education to benchmark best practices in neighboring towns and to incorporate them into our system. Proficiency in this subject is of paramount importance in preparing our children for their future careers, especially with the continuous growth of STEM-related jobs. The corollary is that absence of good mathematical skills will permanently close doors to many of these careers. In my experience, Granby has some excellent Math teachers, but they and their students are hampered by the “Eureka Math” curriculum that is in place at present. Examination of the curriculum study materials reveals it to be insipid and thoroughly uninspiring, placing unnecessary emphasis on pedantic expositions that do little to strengthen mathematical skills. It is no wonder then, that it is almost uniformly reviled by students and parents alike. It is not evident that the curriculum receives enthusiastic support from the teachers either. It is not clear what drove the choice of this curriculum in the first place, for there was no communication with parents when it was made. There are other, far better, approaches to be had, such as the Singapore Math curriculum. In fact, it should be noted that Simsbury employs a variant of Singapore Math, and it has already been shown that their performance surpasses that of Granby.
In summary, the statistics that are constantly being cited regarding school performance in Granby do not tell the whole story. As taxpayers, we are paying substantially more than our neighbors and receiving less value just to maintain an expensive “rural feel.” A more pernicious consequence of this thinking is that it shortchanges our children’s futures. The world that they will emerge into as adults is going to demand a lot more of them than it did previous generations and it behooves us to prepare them for this future.
Dilip Prasad lives in Granby with his wife and two children who attend the local schools. He has worked with United Technologies Corporation for 22 years and is currently an engineer at Pratt and Whitney. He is passionate about STEM education and believes that every child has the ability to succeed in these areas. His own educational background comprises undergraduate and advanced degrees in Mechanical Engineering and Applied Mathematics, including a Ph.D. from MIT.